California’s economy is booming, so why is it No. 1 in poverty?
By Chris Kirkham
Los Angeles Times
From a quick glance at the headline numbers, California’s economy looks to be in its strongest shape in years.
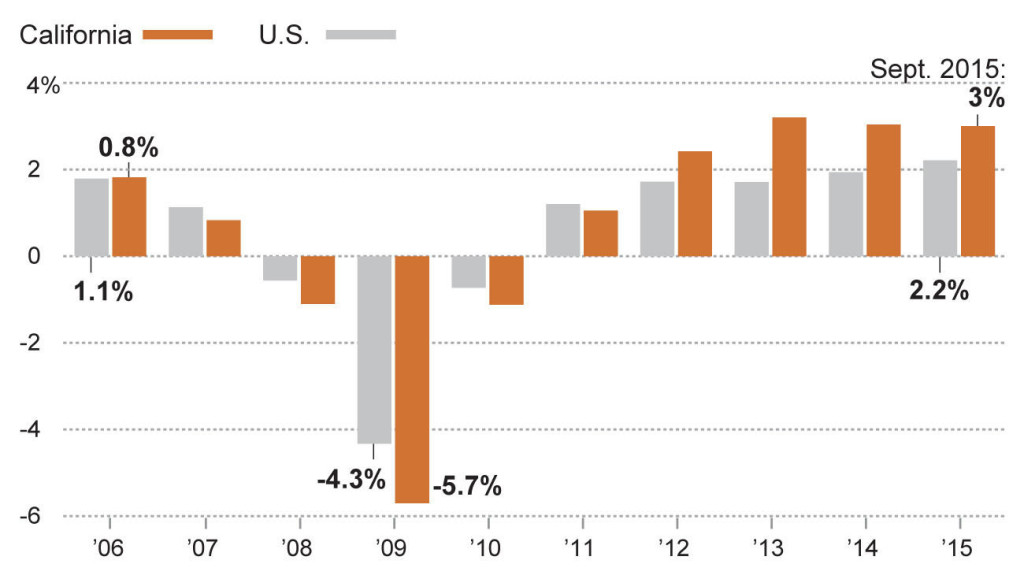
Over the last four years, California has added jobs at a rate faster than all but six other states, and faster than the U.S. overall.
The state unemployment rate is at 5.9%, the lowest since November 2007, and significantly below the 25-year average of 7.5%.
Job market growth
California has added jobs at a faster rate than the rest of the country in recent years.
Source: U.S. Bureau of Labor Statistics
Angelica Quintero/@latimesgraphics
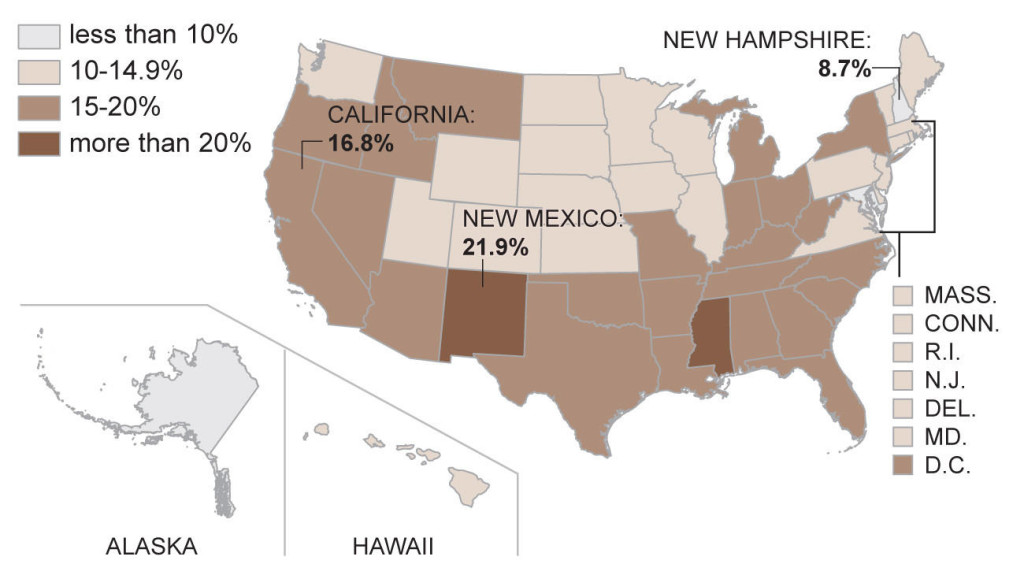
But that swift economic growth hasn’t improved the fortunes of California’s poorest. The state’s official poverty rate (based on a federal threshold of $24,230 for a family of four) is at 16.4%, according to the most recent census data from 2014, up from 12.4% in 2007.
That puts California in about the top third of all states across the country.
The gap between 2007 and 2014 is higher than all but three other states (Nevada, Florida and New Mexico).
Official U.S. poverty rate
Percentage of people in poverty by state in 2013.
Source: U.S. Census Bureau
Angelica Quintero/@latimesgraphics
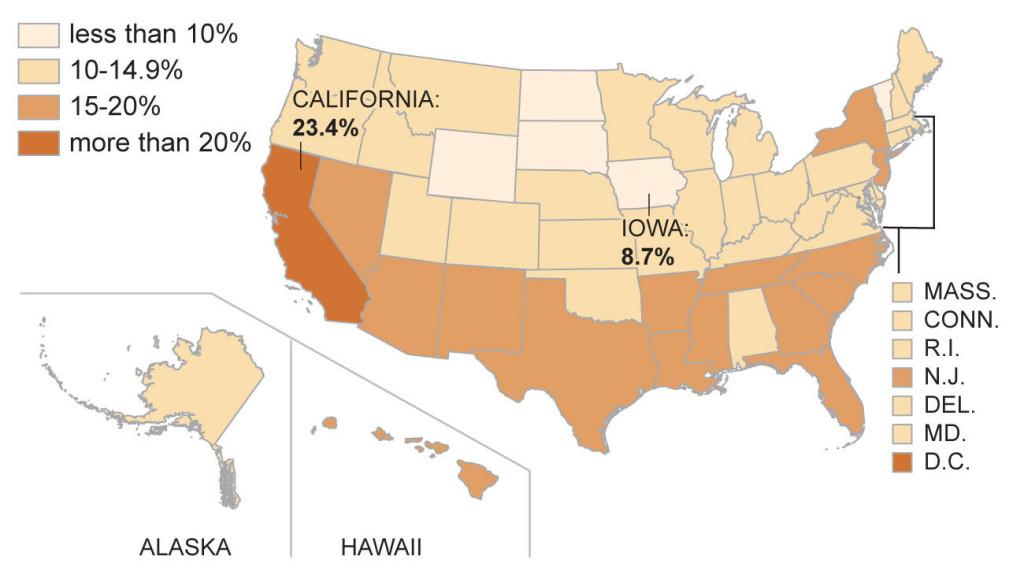
Moreover, many experts say the official poverty rate fails to account for variations in public benefits and costs of living. A separate federal benchmark, known as the Supplemental Poverty Measure, shows a much higher poverty rate for California: 23.4%, the highest in the nation, according to the most recent data.
The rate reflects California’s high — and growing — housing costs.
“The fact that California housing is so much more expensive means the threshold to be in poverty is a lot higher,” said David Cooper of the Economic Policy Institute in Washington.
Adjusted poverty rate
Percentage of people living in poverty by state in 2013. Based on a census measure that factors in costs of housing, food, utilities and taxes.
Source: U.S. Census Bureau
Angelica Quintero/@latimesgraphics
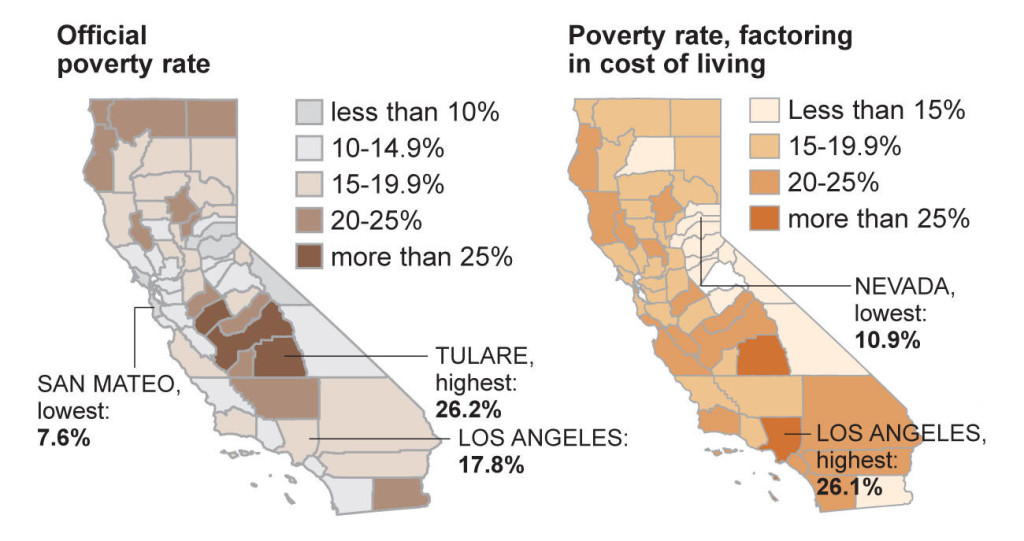
Because California is so diverse, poverty rates can differ widely across the state. Using the government’s official rate, poverty appears to be highest in Central Valley areas such as Tulare County, Fresno County and Merced County. Some wealthy coastal areas such as San Mateo County and Marin County have some of the lowest poverty rates in the state, according to the official statistics.
But because housing costs vary dramatically between coastal and inland areas, policy groups have come up with a separate measure — the California Poverty Measure — to account for regional differences.
That measure — from the Public Policy Institute of California and the Stanford Center on Poverty and Inequality — shows some of the highest poverty rates in expensive coastal areas of Los Angeles, San Francisco and Orange counties.
Cost of living makes an impact on poverty
The percentage of people living in poverty in each county differs widely when factoring in costs such as housing.
NOTE: Measurements in counties subject to different margins of error. Maps reflect most recent estimates.
Sources: U.S. Census Bureau, the Stanford Center on Poverty and Inequality, Public Policy Institute of California
Angelica Quintero/@latimesgraphics
Regardless of the measure, declining wages for the low and middle classes are a big contributor to elevated poverty rates.
Median wages in California declined significantly during the Great Recession, according to an analysis of U.S. census data by the California Budget & Policy Center.
“Millions of people in our state are not benefiting from our growing economy,” said Alissa Anderson, a senior policy analyst with the group.
Wage declines
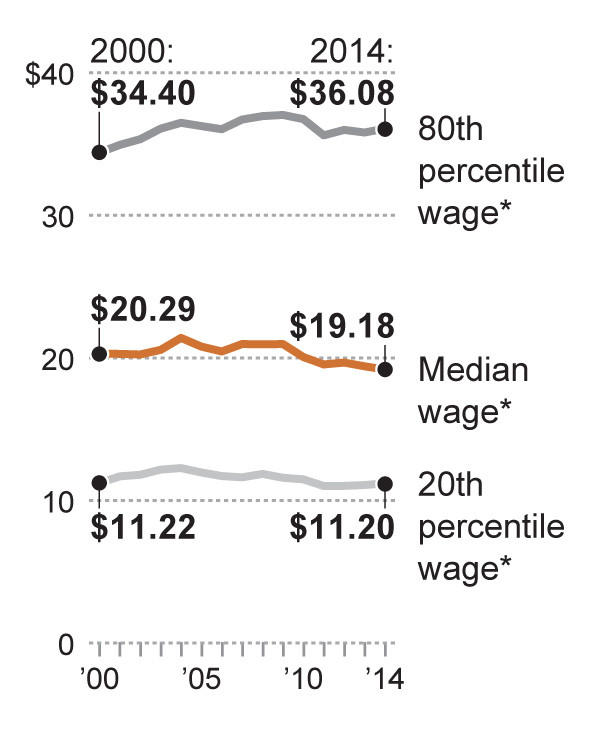 *California hourly wages by percentile, 2000-2014 (2014 dollars). Workers ages 25 to 64.
Source: U.S. Census Bureau
Angelica Quintero/@latimesgraphics
Despite the jobs recovery, hourly wages for low-and-middle-income Californians continue to decline.
Though income inequality has been increasing across the U.S., the effects are more extreme in California. Since 2006, median wages have declined 6.2% in California, compared with a drop of 1.9% for the U.S. overall.
By contrast, wages for the top 10% of earners increased 4.8% in California from 2006 to 2014, compared with a gain of 2.6% for the U.S. overall.
Source: Los Angeles Times


Comments are closed.